CH1Counting has to be complete
The FPGA records triggered waveforms into its own memory and plays them out in batches over PCIe, by DMA, into a ring of four slots in shared memory. The stack note covers that path. If the screen draws only the batches it gets to between frames, it misses waveforms: measured that way on our DHO924S, 33 to 89 % of the acquired waveforms reached the display, depending on the time base.
So the acquisition engine counts. Every batch it reads goes to worker threads while the acquisition thread arms the next one, and a ring slot is reused only after the workers are done with it. Every waveform is counted by construction. If counting ever fell behind, it would show as a lower waveform rate, and the engine measures the time it spends waiting for the workers so that cost stays visible.
CH2The counting kernel
The hit map is the plot in pixels, about 900 by 430, with a 16-bit saturating count per pixel, stored column by column. Each channel's samples arrive scaled to 7,500 codes a division around mid-scale, whatever the volts per division, so a code's row comes from one integer expression, and the division by a constant compiles to a multiply. The kernel reads the 16-bit codes where the DMA left them, with no copy.
- Vectors. For each pixel column the kernel takes the lowest and highest sample, including the sample before the column so the line from the previous column comes in, and lights the rows between. With two or four channels on, it reads each column's samples once as a lane of all the channels' codes and takes the minimum and maximum of every lane with NEON. Four channels at 2 µs/div cost 70 µs per frame and channel on a Cortex-A72 this way, against 100 µs channel by channel.
- Cache. A worker counts every frame of its share of a batch into one 32-column block of the map before moving to the next block. A block is 27.5 KB and fits in an A53 core's L1 data cache; the whole map is 774 KB, larger than the A53 cluster's L2. The map then passes through the cache once per batch instead of once per waveform.
- Differences for the fast frames. At 20 ns/div a batch holds about 1,000 frames, and every edge of a square lights a whole column. For batches over 256 frames each vector is written as a difference: +1 at its top row and −1 below its bottom row, two writes whatever its height. A running sum down each column turns the differences back into exact counts. With NEON summing eight rows at a step, a 900 by 430 plane takes 1.2 ms on an A72, against 3.3 to 3.8 ms in scalar code, so a worker sums its planes once 512 frames or 50 ms have built up. A stopped screen always shows every frame.
CH3Threads and the scheduler
Four workers run at nice 10, free on all six cores; the first two take any batch and the other two only the large ones, so the slower time bases' small batches are not spread thinner. The UI's render thread runs on one Cortex-A72 and the acquisition thread on the other. The placement was measured: workers confined to the acquisition thread's core cut the rate at 20 ns/div from 28,602 to 20,285 waveforms a second, and confined to the four A53s they fell behind at 20 ns/div.
Three scheduling details decided whether counting costs anything:
- The time slice. Linux 6.12's EEVDF scheduler lets a running thread finish its slice before a woken one runs, and the base slice on the RK3399's six cores is 2.1 ms. A worker sharing a core with the acquisition thread held back its look at the next batch. The acquisition thread asks for a 200 µs slice through
sched_setattr, and four channels counted rose from about 3,350 waveforms a second to about 3,550. - Microsecond pauses. Arming a capture includes 1 µs pauses between register steps. On Linux a 1 µs sleep costs the thread's 50 µs timer slack plus a wake-up, and an arm took 353 µs. Pauses up to 20 µs now spin, and an arm takes 28 to 35 µs.
- A fair hand-over. The UI takes the counts from per-worker maps. With a backlog, a worker releases its map and takes it again at once, the standard mutex is not fair, and on our unit a take once waited 2.08 s. A take in progress now makes the workers stand aside before their next task, and a task counts at most 128 frames, so a take waits for one task at most.
Nothing runs while nobody looks: batches are handed to the workers only while a client has taken counts in the last 2 s, and the workers sleep on a condition variable.
CH4The GPU side
Each frame, the UI takes the counts gathered since its last take. Only the band of rows that has hits crosses the socket, which brought the UI's take thread from 30 % to 5 % of a core. The Mali-T860 does the rest in OpenGL ES 3:
- Accumulate. The take is uploaded as one 16-bit integer texture and added to a half-float persistence layer through one quad with additive blending.
- Fade. Persistence is exponential in time: one quad multiplies the layer by the decay for the time since the last frame, from 100 ms to 10 s, or not at all for infinite persistence. Clear, or a change of time base, delay or channel scale, drops the layer at once.
- Normalise. The hottest pixel is found on the GPU: a maximum over 16 by 16 blocks into a small texture, then over that into a 1 by 1 texture. Nothing is read back to the CPU.
- Grade. The channel's colour by intensity, the colour grade, or a temperature palette from blue to red, on a linear or logarithmic scale. Wave Intensity bends the curve, and rare-hit emphasis draws any pixel hit at most n times in the coolest colour at full strength. A test checks every palette with a glitch once in 100,000 waveforms.
- Headroom. A half float's largest value is 65,504, and a pixel summed past it becomes infinite, which turns every other pixel's share of the hottest to zero. The layer is capped at 61,440, exact in fp16, with a MIN blend after each add, so infinite persistence can run for as long as you like.
Weighted vectors are an option: a waveform that lights L rows in a column adds about 16/L to each, so a flat stretch shows brighter than a fast edge through the same rows, as an analog beam would draw it. The newest trace, the grid and the menus are composited on top. On a busy screen the DHO's panel runs at 56 to 59 frames a second, and with the engine counting the UI draws two to four times as many frames as when it drew the batches' samples itself.
What it gives
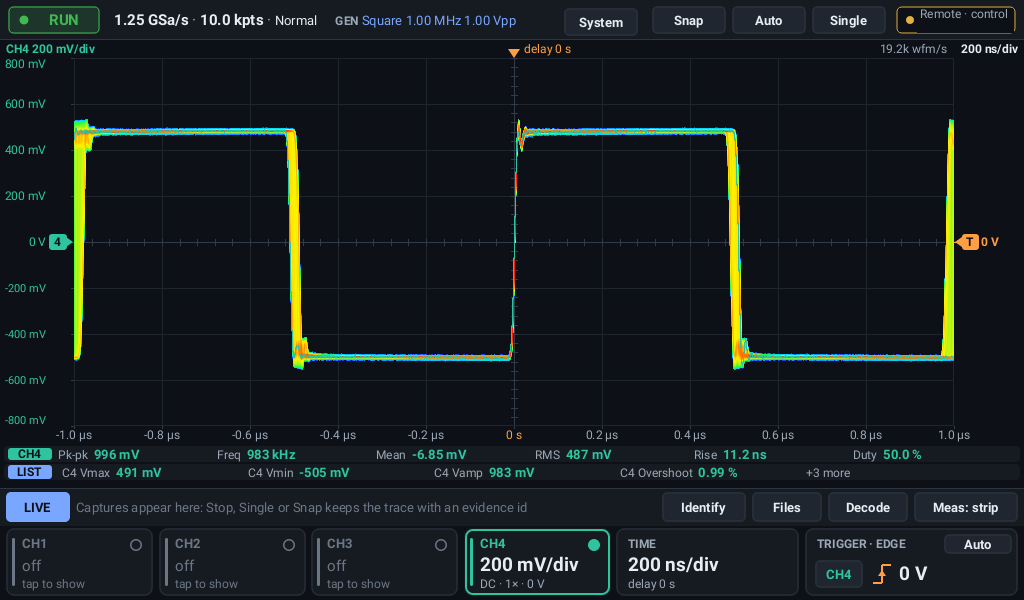
Our DHO924S, the built-in generator's 1 MHz square on CH4, 10 kpts, vectors, infinite persistence:
| Scene | Waveforms a second, four workers | Two workers | Counted |
|---|---|---|---|
| 20 ns/div, one channel | 58,573 | 41,328 | every one |
| 2 µs/div, one channel | 11,785 | 11,784 | every one |
| 2 µs/div, four channels | 3,546 | 3,546 | every one |
The counted share is the engine's count of waveforms counted against waveforms acquired, read a moment apart, so it moves a few tenths of a percent either side of 100. At 2 µs/div counting costs nothing measurable: 10,702 waveforms a second counting against 10,703 with the workers off, in one A/B. At 20 ns/div the workers are the limit; with counting off the engine acquires about 77,800 a second. On our MHO934 the engine counts 50,365 waveforms a second at 20 ns/div and 4 GSa/s, and 13,765 at 2 µs/div. Against Rigol's firmware, counted the same way on the trigger output, see NovaOS vs stock.
Because every waveform is counted, a box drawn on the display can act as a trigger. When the hit density inside the box crosses a level (or, for a pulse that must always pass through, falls under it), NovaOS stops, beeps or keeps the waveform that did it, which it finds again in the ring by testing only the box's columns of the frames still there.
Measured on our own DHO924S and MHO934 in October 2026. The per-pixel hit count with graded intensity and exponential persistence is an old technique whose original patents have expired; this implementation is our own.